
GHG Management
All FENC production sites must comply with ISO 14064-1 or local regulatory standards on the quantification and reporting of GHG emissions.
GHG Management Guidelines and Measures
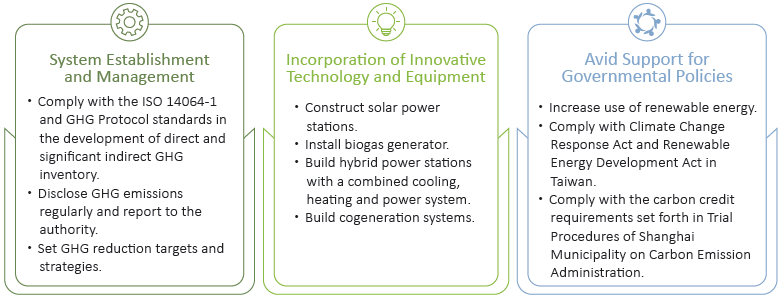
System Establishment and Management
All FENC production sites conduct GHG inventory in accordance with the ISO 14064-1:2018 standards. The Company references the GHG Protocol published by World Business Council for Sustainable Development (WBCSD) as the basis for developing emission categories and divides categories 3 to 6 (scope 3 of GHG Protocol) into 15 reporting categories related to indirect emissions, such as purchased goods and services, fuel-and energy-related activities, upstream and downstream transportation and employee commuting. The next phase entails more frequent third-party verifications, up from once every three years to annual verifications to ensure the credibility of the inventory.
The results are analyzed to identify emission hot spots to be monitored regularly, and FENC adjusts its carbon reduction approaches accordingly to reach the reduction goals. Additionally, the Company is in the process of introducing internal carbon pricing as a management tool. Currently, the focus is on studying global trends as well as internal and external carbon costs in order to determine appropriate internal charges for carbon emissions. Aside from being an incentive for carbon reduction, the measure will support special projects that further the cause and R&D in new technologies that will lead FENC forward on its carbon reduction pathway.
GHG Emissions in 2022
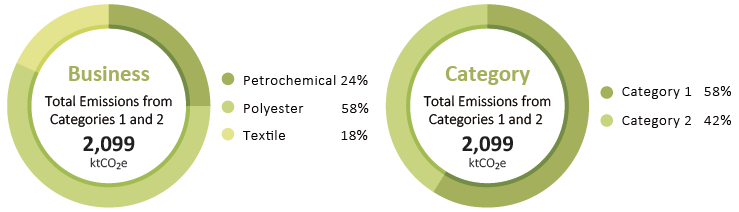
Direct and Energy Indirect GHG Emissions (Market-Based)
Unit: ktCO2e
Direct Emissions Category 1 | Energy Indirect Emissions Category 2 | Category 1 and 2 Total | ||
Petrochemical | 2020 | 364 | 195 | 559 |
2021 | 389 | 152 | 541 | |
2022 | 352 | 150 | 502 | |
Polyester | 2020 | 771 | 655 | 1,426 |
2021 | 805 | 537 | 1,342 | |
2022 | 742 | 484 | 1,226 | |
Textile | 2020 | 137 | 310 | 447 |
2021 | 146 | 326 | 472 | |
2022 | 124 | 247 | 371 | |
Total | 2020 | 1,272 | 1,160 | 2,432 |
2021 | 1,340 | 1,015 | 2,355 | |
2022 | 1,218 | 881 | 2,099 | |
Direct and Energy Indirect GHG Emissions (Location-Based)
Unit: ktCO2e
Direct Emissions Category 1 | Energy Indirect Emissions Category 2 | Category 1 and 2 Total | ||
Petrochemical | 2020 | 364 | 195 | 559 |
2021 | 389 | 152 | 541 | |
2022 | 352 | 150 | 502 | |
Polyester | 2020 | 771 | 655 | 1,426 |
2021 | 805 | 537 | 1,342 | |
2022 | 742 | 500 | 1,242 | |
Textile | 2020 | 137 | 310 | 447 |
2021 | 146 | 326 | 472 | |
2022 | 124 | 247 | 371 | |
Total | 2020 | 1,272 | 1,160 | 2,432 |
2021 | 1,340 | 1,015 | 2,355 | |
2022 | 1,218 | 897 | 2,115 | |
| Note: 1. The scope of data collection covers 21 production sites, which account for 100% of the production sites. The consolidation approach for emissions is operational control. 2. GHGs include CO2, CH4, N2O, HFCs, PFCs, SF6 and NF3. ISO 14064-1:2018 categorizes emission sources into direct (category 1, emission source from directly owned or controlled by the organization) and indirect (category 2, indirect GHG emissions from imported energy such as electricity, heat and steam). 3. In 2020, 100% of the emission data passed the internal audit; 66% passed the third-party verification for the ISO 14064-3 standards or local regulations, including Hsinpu Chemical Fiber Plant, Kuanyin Chemical Fiber Plant, OPTC, OPSC and FEIS. 4. In 2021, 100% of the emission data passed the internal audit and third-party verification for the ISO 14064-3 standards. 5. In 2022, 100% of the emission data passed the internal audit; 71% passed the third-party verification for the ISO 14064-3 standards, including Hsinpu Chemical Fiber Plant, Kuanyin Chemical Fiber Plant, Hukou Mill, Kuanyin Dyeing and Finishing Plant, OPTC, FEFC, OTIZ, the polyester plant of FEPV and the knitting and dyeing plant of FEPV. 6. In 2022, the total direct and indirect emissions (categories 1 and 2) from four FENC production sites in Taiwan are 713 ktCO2e. |
Direct and Energy Indirect GHG Emissions per Unit of Production
Unit: tCO2e / metric ton of production
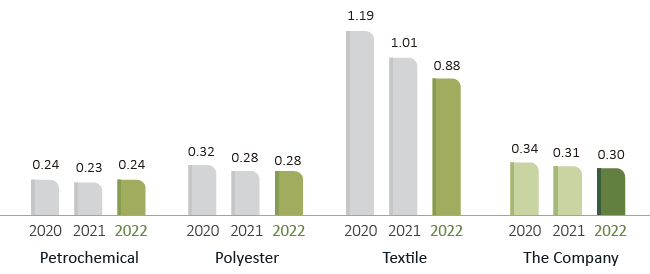
Direct and energy indirect emissions (categories 1 and 2) in 2022 dropped by 11% compared with the previous year, which is a testimony to the performance of the FENC’s GHG reduction projects. Through energy conservation measures and increase in renewable energy use, energy indirect emissions were cut by 134 ktCO2e in 2022. Direct emissions were also down by 120 ktCO2e due to equipment improvements and the switch to alternative fuels.
Other Indirect GHG Emissions in 2022 (Category 3 to 6)
Unit:ktCO2e
| Petrochemical | Polyester | Textile | Total |
Purchased Goods and Services | 2,484 | 4,382 | 692 | 7,558 |
Capital Goods | 20 | 34 | 3 | 57 |
Fuel and Energyrelated Activities | 89 | 259 | 70 | 418 |
Upstream Transportation and Distribution | 66 | 40 | 6 | 112 |
Waste Generated in Operations | 7 | 4 | 3 | 14 |
Business Travel | 0.04 | 0.86 | 0.28 | 1.18 |
Employee Commuting | 0.47 | 19 | 11 | 30 |
Upstream Leased Assets | 2 | 0.51 | 0.48 | 3 |
Downstream Transportation and Distribution | 74 | 294 | 30 | 398 |
Downstream Leased Assets | 0.10 | 0.06 | 0 | 0.16 |
Franchises | 0 | 0 | 0 | 0 |
Investments | 0 | 0 | 0 | 0 |
Total | 2,743 | 5,033 | 816 | 8,592 |
| Note: 1. The scope of data collection covers 21 production sites, which account for 100% of the production sites. The consolidation approach for emissions is operational control. 2. Significant indirect GHG emissions are identified in accordance with ISO 14064-1:2018 and divided into 15 reporting categories based on the GHG Protocol. 3. FENC focuses on the production of polyester and raw materials with an array of terminal applications. The GHG emission generated from the processing, use and end-of-life treatment of sold products must be calculated based on specific scenarios. Due to the lack of objectivity and reference value, the data is excluded. 4. FENC production sites do not engage in franchising or investment activities, thus without GHG emissions under the two categories. |
Other Indirect GHG Emissions (Category 3 to 6)
Unit:ktCO2e
| 2021 | 2022 |
Purchased Goods and Services | 7,754 | 7,558 |
Capital Goods | 53 | 57 |
Fuel and Energyrelated Activities | 431 | 418 |
Upstream Transportation and Distribution | 239 | 112 |
Waste Generated in Operations | 12 | 14 |
Business Travel | 1.66 | 1.18 |
Employee Commuting | 24 | 30 |
Upstream Leased Assets | 50 | 3 |
Downstream Transportation and Distribution | 429 | 398 |
Downstream Leased Assets | 0.07 | 0.16 |
Franchises | 0 | 0 |
Investments | 0 | 0 |
Total | 8,994 | 8,592 |
| Note: 1. The scope of data collection covers 21 production sites, which account for 100% of the production sites. The consolidation approach for emissions is operational control. 2. Significant indirect GHG emissions are identified in accordance with ISO 14064-1:2018 and divided into 15 reporting categories based on the GHG Protocol. 3. FENC focuses on the production of polyester and raw materials with an array of terminal applications. The GHG emission generated from the processing, use and end-of-life treatment of sold products must be calculated based on specific scenarios. Due to the lack of objectivity and reference value, the data is excluded. 4. FENC production sites do not engage in franchising or investment activities, thus without GHG emissions under the two categories. 5. In 2021, 100% of the emission data passed the internal audit and third-party verification for the ISO 14064-3 standards. 6. In 2022, 100% of the emission data passed the internal audit; 71% passed the third-party verification for the ISO 14064-3 standards, including Hsinpu Chemical Fiber Plant, Kuanyin Chemical Fiber Plant, Hukou Mill, Kuanyin Dyeing and Finishing Plant, OPTC, FEFC, OTIZ, the polyester plant of FEPV and the knitting and dyeing plant of FEPV. |
Incorporation of Innovative Technology and Equipment
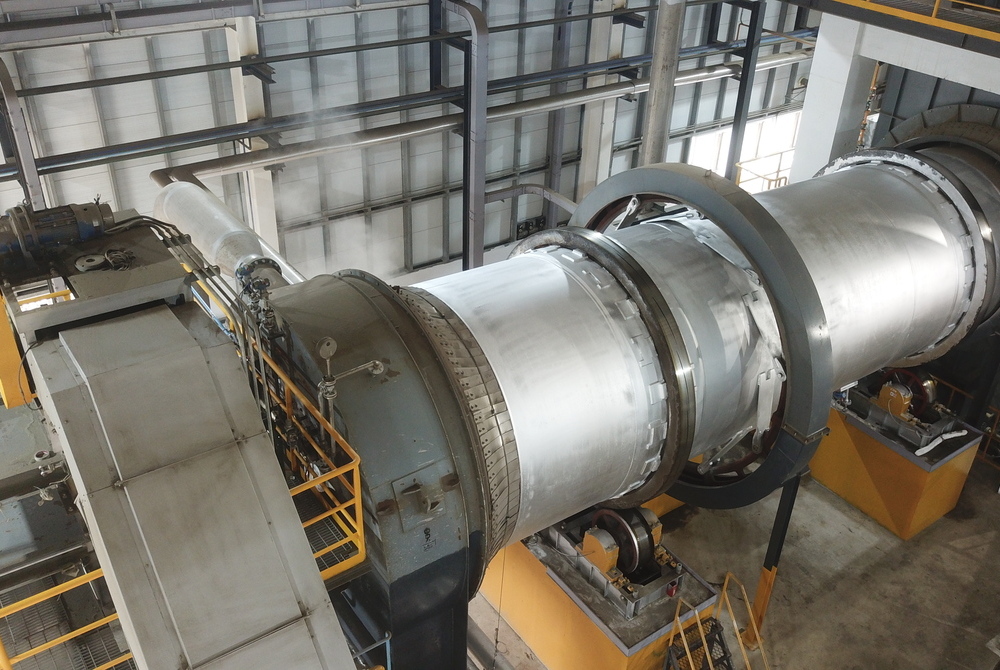
OGM invested NT$180 million in the treatment of the sludge and waste labels the plant generated. At the end of 2022, OGM constructed the heat recovery boiler plant and began incinerating 450 metric tons of waste labels as well as 140 metric tons of sludge a month. The heat generated during incineration took the place of the natural gas boiler as an alternative energy source. In addition to reducing waste treatment fees, another benefit is that the recovered heat produces steam that can power the plant facilities. In the pipeline for 2023 is the installation of rooftop solar panels with 273kW in capacity, which brings the total installed capacity of solar power to 764kW, taking OGM closer to net zero.
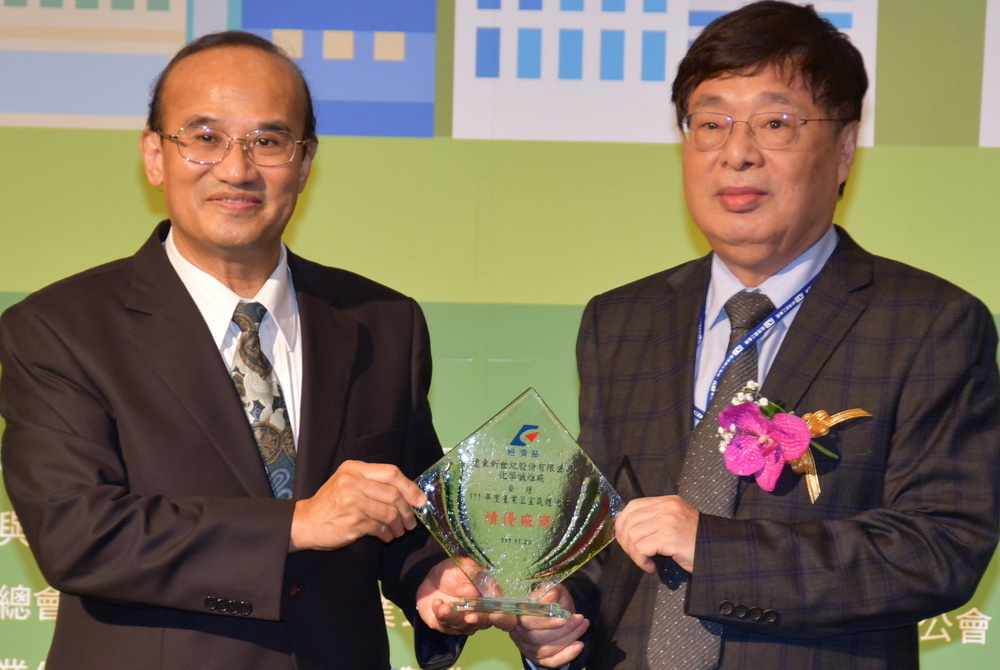
OGM is the first waste recycling plant in Taiwan to install its own solar power facility. By 2025, the plant will reach 1,700kW in installed capacity for renewable energy. On November 16, 2022, OGM received the High Distinction Award for Subsidized Entities as well as the Resource Recycling Label from the Environmental Protection Administration of Executive Yuan!
Avid Support for Governmental Policies
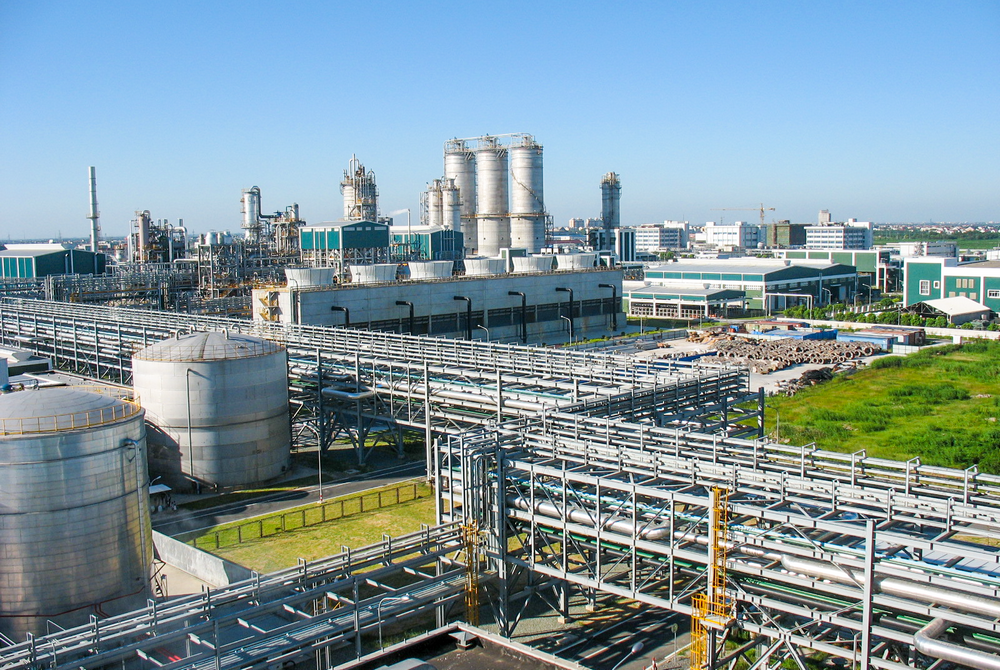
The enactment of Trial Procedures of Shanghai Municipality on Carbon Emission Administration in 2013 puts a cap on carbon emission for OPSC and FEIS. The two subsidiaries ensure regulatory compliance by formulating various carbon reduction and monitoring measures and establishing energy conservation and carbon reduction goals at each year end for the coming year. The progress is reviewed monthly during energy conservation meetings, where improvement measures are also proposed with designated lead agency for action. Each day, staff track the fluctuation of carbon pricing and report the observation during monthly meetings.
The Chinese government mandates corporate efforts in carbon reduction through its national emission trading scheme, and the emission allowance allocated in the system has been decreasing by the year. The COVID-19 pandemic prompted OPSC to switch to low-load operation in 2022, resulting in lower residual heat generated and higher demand for boiler steam produced from natural gas. OPSC exceeded the carbon emission cap and had to replenish the allowance with unused carbon balance. OPSC completed the steam turbine retrofitting project during the year and installed a rooftop solar station with 400kW in capacity. OPSC will continue to improve upon its equipment and production while expanding solar power facilities in anticipation of the decreasing carbon allowances the Chinese government will be issuing. FEIS implemented multiple energy conservation projects during this period. The plant reduced carbon emissions through constructing hybrid power stations with a combined cooling, heating and power system and purchasing renewable energy certificates. The plant plans on purchasing renewable energy certificates each year and adding solar power stations with 26,300kW in capacity, which will supply approximately 12% of the total electricity consumed by FEIS.
Carbon Quotas and Emissions of OPSC and FEIS
Unit:ktCO2e
|
| 2019 | 2020 | 2021 |
OPSC | Quota | 161 | 109 | 100 |
Actual Emissions | 150 | 115 | 118 | |
FEIS | Quota | 328 | 207 | 208 |
Actual Emissions | 309 | 219 | 184 |
| Note: 1. The quota in 2022 were estimated emissions; the actual quota is yet to be verified by the government. 2. The 2021 carbon allowance was updated to reflect the actual allocation by the authority. Actual emissions in 2021 were updated to reflect the data approved by the authority. The 2021 allowance and actual emissions both decreased due to government adjustments on the carbon emission factors for electricity and steam. |