Loading...


FENC pursues ongoing refinement and harmonious coexistence with society and environment, joining hands with stakeholders for a sustainable future.
Being committed wholeheartedly to sustainable actions, FENC is a positive force, bringing innovations to the world. The Company is on course to create a beautiful new century.

We embed carbon reduction into our core operations, driving low-carbon transformation in materials, processes, and products to achieve a net-zero future.
FENC achieved a 34% reduction in carbon emissions in 2024 compared to 2020—exceeding our short-term target ahead of schedule. We are committed to a green transformation with ambitious 2030 goals: a 50% reduction in GHG emissions, 50% of production revenue from green products, and 50% of raw materials sustainably sourced. We engage in global climate dialogue, sharing our achievements in the circular economy and emissions reduction at COP29’s Blue Zone. Recognition on the CDP A List demonstrates our excellence in net-zero strategy and climate leadership.
The Sustainability Journey Begins with Polyester
Through the advantages of vertical integration and cross-field technical cooperation, we apply the core capabilities of the Company to create an endless circular economic model.
Click for more information


With a diverse product lineup, FENC established R&D Center in Taiwan and U.S. The two entities focus on the development of highly specialized products as well as the advancement and applications of recycling technologies. Product categories span high-functional polyester and environmental protection, etc. The Company also founded Innovation Direct to Market (IDM) and a cross-industry technological platform to align with the R&D resources from brand customers and fast-track the commercialization of innovative products.
view more
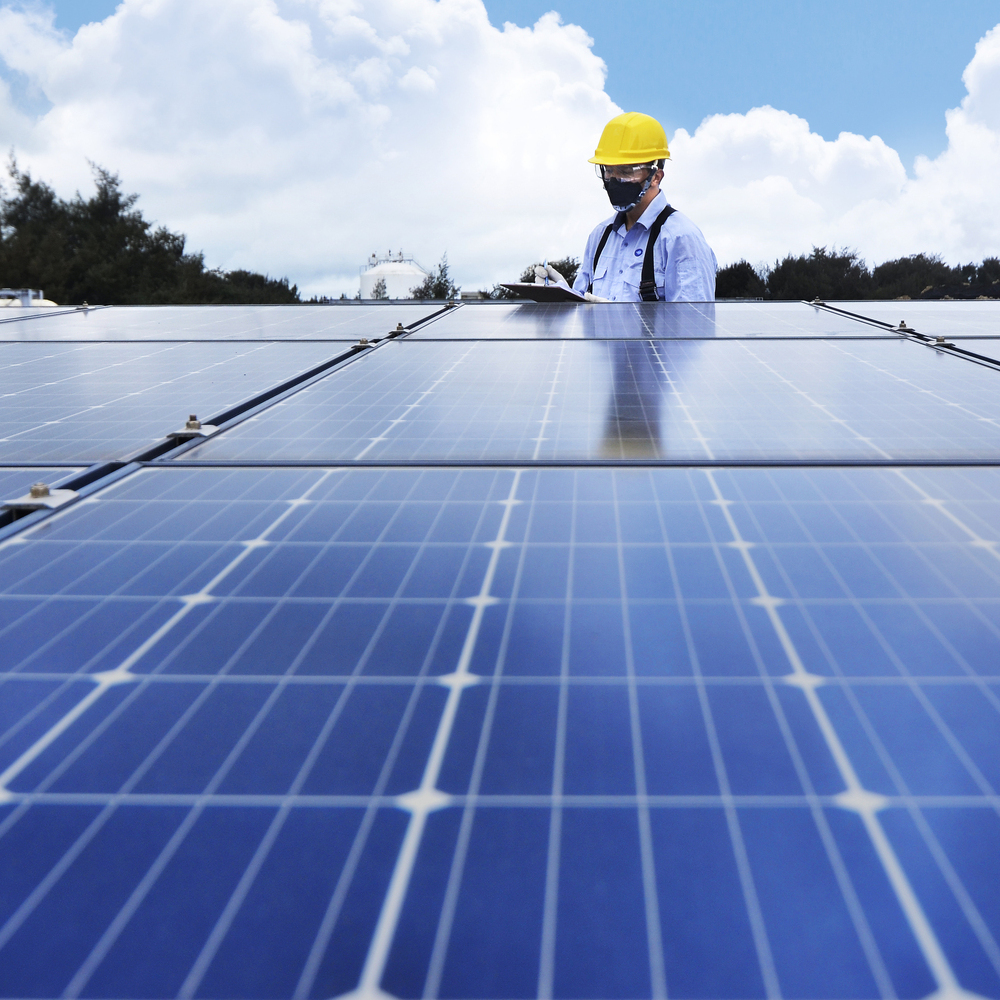
FENC takes pragmatic steps towards carbon reduction, establishing carbon-reduction strategies and building green operation through carbon-reduction pathways. In order to reach its 2030 GHG reduction targets, it is estimated that the Company will invest NT$15 billion and avert 1.65 MtCO2e in carbon emissions.
view more
FENC delves into the circular economy for over three decades, the Company upgrades its recycling technologies continuously, upcycling waste materials and turning them into a wide array of high-quality rPET applications. rPET resins made from post-consumer PET bottles cut GHG emissions by 63% compared to those of petroleum origin. FENC devotes long-term research and development efforts to biomass as a replacement for fossil fuels to minimize their environmental impacts. Products that are most representative of the fruit of this effort are bio PET, which is made of biomass materials.
view more
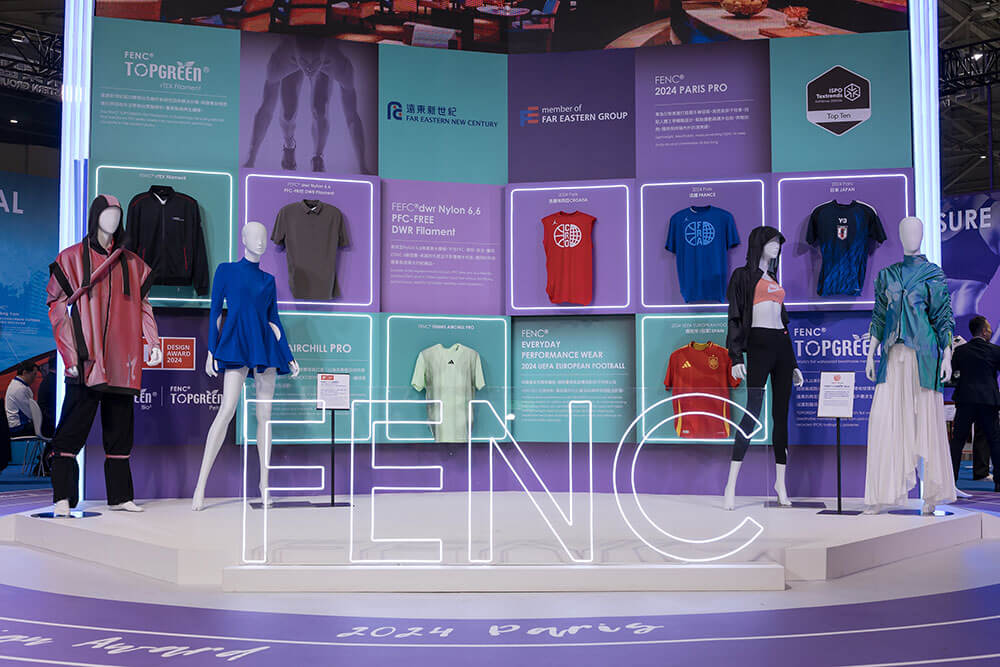
FENC possesses strong capabilities in circular economy, offering comprehensive transformation solutions through its “land, ocean, and air” waste-to-resource initiatives. The Company has also pioneered the conversion of electronic waste into high-quality recycled PET, opening up new avenues for PET recycling and reuse. Green textiles made from recycled PET bottles have been adopted by multiple countries for the 2024 Paris Olympics. Additionally, at COP29 , FENC impressed audiences with its innovative waste-based products — the " Ocean Recycled Anti-Bursting Jerseys" and "100% Recycled Polyester Sneakers."
view more
FENC formulates functional training courses for different employee roles and continues to provide training courses and learning activities in response to current trends. FENC promotes hybrid learning and launches three major programs focusing on the cultivation of sustainable, digital and global competence. FENC creates a learning model with different themes every season. The Company also establishes an academy-style learning system on its digital learning platform, providing a wide array of courses for employees to select from based on their personal development needs.
view more
FENC is a global leader in recycled polyester (rPET), with advanced recycling technologies and full industry integration. The Company has delivered multiple world- and Taiwan-first innovations in rPET applications, driving progress in the circular economy. In 2024, FENC launched 100% rPET meat trays, produced the world’s first surfactant containing rPET, and developed automotive airbags made from 100% chemically recycled polyester yarn — setting new benchmarks for the industry.
view more
FENC promotes sustainable development with innovation, expanding the new chapter of sustainability blueprint.

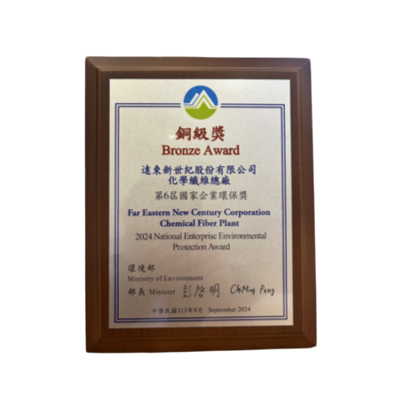
All-round sustainable performance has been affirmed by domestic and international competitions and awards, creating a sustainable milestone

For questions or comments regarding FENC sustainability, please contact us through email or the online forms. We will be happy to answer them for you.