
Recruitment and Retention
FENC fortifies labor structure with comprehensive human resources system.
FENC is adamant about providing a friendly workplace with zero tolerance for discrimination of any form. A corporate mentorship program is in place to provide new employees support in life and at work in the first three months of employment. Managers or senior staff are assigned to help them get acquainted with work and the environment quickly, which has been effective in lowering the turnover rate among new employees. FENC continued to recruit talent from wide disciplines in 2024 through diverse channels, including job banks, recruitment consultants and dispatch agencies, to facilitate robust succession planning for its operation across the globe. To replenish its sales and administrative force, the Company has tapped into the recruitment mechanism of job banks. To bolster its talent pool at the middle and senior level, the recruitment team relies on the long-term partnerships with more than 20 recruitment consultancies, from which the team received over 100 referrals of management professionals for mid-level positions and above during the reporting year. These channels have given FENC diversified talent recruitment options.
FENC also works closely with dispatch agencies, through which the Company has supplemented its need for professional talent, including senior consultants and experienced production personnel. To achieve corporate sustainability and fulfill social responsibilities, FENC examines employment agencies’ compliance with applicable labor regulations prior to contracting the service. The review plays a key role during the evaluation of the collaboration to protect the rights of dispatched personnel.
In 2024, FENC stepped up the talent acquisition efforts in the field of green materials to fuel its product transformation. Its production sites in Vietnam also saw a growing need for manpower to fulfill the increasing orders after being certified by customers. A human resource inventory was conducted across FENC to focus on promoting and training current employees. The effect of this strategy can be observed from the percentage of open positions filled through internal recruitment, which is also reinforced through the job rotation program to empower employees and maximize their potential. However, in an effort to attract more top talent, FENC has increased recruitment spending to concentrate on building a stronger employer brand.
Statistics on New Employee Hires
2021 | 2022 | 2023 | 2024 | ||
Number of New Employee Hires | 7,748 | 8,345 | 3,086 | 6,462 | |
The Ratio of New Employee Hires | 36% | 38% | 14% | 32% | |
The Ratio of Internal Promotion and Rotation | 83% | 58% | 63% | 82% | |
Number of New Employee Hires -By Gender | Male | 3,297 | 3,403 | 1,725 | 2,434 |
Female | 4,451 | 4,942 | 1,361 | 4,028 | |
Number of New Employee Hires -By Age | Under 30 | 4,990 | 5,439 | 1,566 | 3,668 |
31~50 | 2,723 | 2,872 | 1,484 | 2,750 | |
Over 51 | 35 | 34 | 36 | 44 | |
Average Recruitment Costs | 3,866 | 5,221 | 14,751 | 12,116 | |
Note: 2. The Ratio of Internal Promotion and Rotation: [(Number of Employees Internally Promoted + Number of Employees Internally Rotated) ÷ Number of Positions Required] x 100% |
1. Campus Recruitment Program
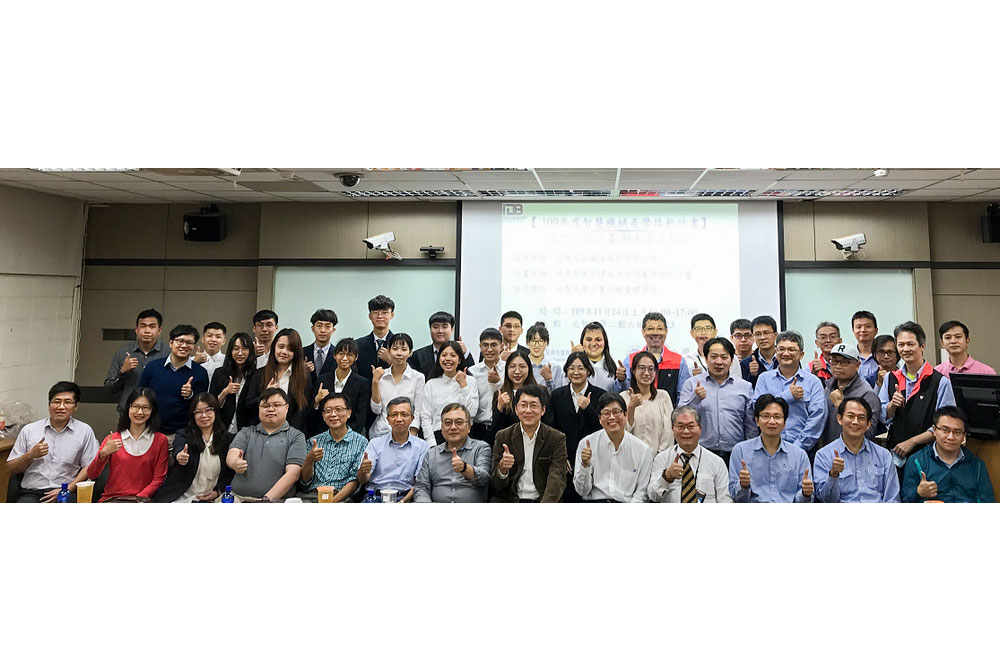
To increase FENC’s visibility among students as an employer brand and build stronger university relations, the recruitment team held eight campus recruitment campaigns in Taiwan during 2024. The campaigns targeted fields of study such as polyester and textile materials; textiles and clothing; chemistry and chemical engineering; business administration and management.
One of the campus recruitment events was the VISION 2024 NTU Campus Recruitment. The campus job fair, which took place at the National Taiwan University, is the largest in Taiwan. FENC built on-site exhibits to showcase its vertically integrated industry chain, innovative technologies and leadership status in the fields of polyester and textiles, which attracted crowds of students gathering for exchange.
To address its demand for talent in the management, R&D, manufacturing and sales departments, FENC held employer information sessions at seven universities in a format that combined a corporate briefing with an alumni sharing program. During the events, FENC gave students an in-depth look into its open positions, corporate systems and company culture, provided career advice and stressed the Company’s corporate values and future development strategies to help students build a sense of identification with and trust in FENC.
In addition to campus recruitment campaigns, the FENC Classic Marathon held by Hsinpu Chemical Fiber Plant has become a spotlight when it comes to managing university relations. FENC provides free registration to students from National Tsing Hua University and National Yang Ming Chiao Tung University to share its corporate culture while promoting health awareness. The event has drawn active student participation throughout the years with the 2024 student registration doubling that of 2023.
.png)
2. The Talent Pool Program
FENC has been implementing the Talent Pool Program since 2012 with the goal of deepening industry-academia collaboration. The program offers internship and career development opportunities to top students from Yuan Ze University and Asia Eastern University of Science and Technology, which are founded by the Far Eastern Group (FEG). The program offered 22 internship opportunities in 2024, and 17 top-performing students were selected. During the internship, the students gained practical experience and an early start in adapting to the corporate culture, which prepared them for future employment.
3. Internal and External Personality Tests
FENC started assessing employees with the DISC personality test in 2023, and over 3,300 employees in Taiwan have completed the test. In 2024, the Company began supplementing job interviews with the personality test, which was completed by over 500 external candidates. The results were a significant aid for managers to determine the person-job fit. At the end of 2024, FIGP became the first overseas FENC site to implement the DISC personality test. Recognizing the effectiveness, the management implemented the personality test for the entire plant to fine-tune employee performance. The next phase is to expand the implementation across FENC’s global production sites. The results of credible personality tests give employees insights into their own personality traits, and managers a clearer perception of their team members’ personalities, strengths and weaknesses, which will optimize work planning, team building and the efficiency of internal collaboration.
Human Resource Statistics in 2024
.png)
Human Resource Statistics
Permanent Employees | Temporary Employees | Total | ||||||||
Male(%) | Female(%) | Number | Male(%) | Female(%) | Number | Male(%) | Female(%) | Number | ||
Taiwan | 2021 | 73% | 27% | 4,176 | 90% | 10% | 888 | 76% | 24% | 5,064 |
2022 | 73% | 27% | 4,177 | 90% | 10% | 884 | 76% | 24% | 5,061 | |
2023 | 72% | 28% | 4,012 | 90% | 10% | 829 | 75% | 25% | 4,841 | |
2024 | 72% | 28% | 3,724 | 92% | 8% | 794 | 75% | 25% | 4,518 | |
Mainland China | 2021 | 55% | 45% | 4,870 | 62% | 38% | 593 | 56% | 44% | 5,463 |
2022 | 57% | 43% | 4,564 | 53% | 47% | 284 | 56% | 44% | 4,848 | |
2023 | 58% | 42% | 4,513 | 46% | 54% | 180 | 58% | 42% | 4,693 | |
2024 | 57% | 43% | 4,105 | 57% | 43% | 138 | 57% | 43% | 4,243 | |
Vietnam | 2021 | 33% | 67% | 10,241 | 36% | 64% | 566 | 33% | 67% | 10,807 |
2022 | 34% | 66% | 11,578 | 54% | 46% | 56 | 34% | 66% | 11,634 | |
2023 | 33% | 67% | 9,629 | 39% | 61% | 148 | 33% | 67% | 9,777 | |
2024 | 34% | 66% | 10,947 | 41% | 59% | 197 | 34% | 66% | 11,144 | |
Japan | 2021 | 84% | 16% | 155 | 76% | 24% | 17 | 83% | 17% | 172 |
2022 | 84% | 16% | 219 | - | - | 0 | 84% | 16% | 219 | |
2023 | 83% | 17% | 264 | 57% | 43% | 46 | 79% | 21% | 310 | |
2024 | 82% | 18% | 300 | 67% | 33% | 9 | 81% | 19% | 309 | |
U.S. | 2021 | 82% | 18% | 180 | 100% | 0% | 4 | 83% | 17% | 184 |
2022 | 82% | 18% | 187 | - | - | 0 | 82% | 18% | 187 | |
2023 | 81% | 19% | 180 | - | - | 0 | 81% | 19% | 180 | |
2024 | 81% | 19% | 172 | - | - | 0 | 81% | 19% | 172 | |
Total | 2021 | 48% | 52% | 19,622 | 67% | 33% | 2,070 | 50% | 50% | 21,692 |
2022 | 48% | 52% | 20,725 | 80% | 20% | 1,224 | 50% | 50% | 21,949 | |
2023 | 49% | 51% | 18,598 | 76% | 24% | 1,203 | 51% | 49% | 19,801 | |
2024 | 47% | 53% | 19,248 | 78% | 22% | 1,138 | 49% | 51% | 20,386 | |
| Note: 1. The term, “permanent employee” in this report is identical to the terms, “permanent employee” and “full-time employee” referenced in the GRI standards. 2. The term, “temporary employee” in this report refers to migrant workers in Taiwan; contract or outsourced workers in mainland China; employees under the probation period in Vietnam; outsourced workers in Japan; temporary workers in the U.S.; temporary employees as referenced in the GRI standards. 3. The headcount is based on the payroll settlement date in December of the current year at all FENC sites. 4. There are no part-time employees or non-guaranteed hours employees at any FENC production sites. |
When it comes to human resources, FENC has always believed in finding the right person for the right position and giving employees the opportunity to develop their full potential. The Company puts such conviction to practice with a comprehensive organizational structure and human resources system. Permanent employees hold 94% of the key positions, and the Company offers internal training, job rotation and internal promotion track for top performers, which demonstrate the comprehensive and diverse opportunities for career advancement at FENC.
The 2024 turnover rate among all employees in Taiwan is 13%, which is considerably lower than the 20.9% average in the manufacturing industry. The low turnover reflects the effectiveness of FENC’s talent retention strategies. Among the FENC sites in mainland China, employee turnover was down by 385, dropping significantly by 30% from the previous year.
FENC sites in Vietnam offers highly competitive salaries at a level 50% higher than the market average. With robust internal and external recruitment strategies as well as a quality workplace, the effectiveness of recruitment and retention is amplified to power its expansion in Vietnam. The number of new employees rose by 4,027 from 2023, a jump by 253%. Among the new hires, 58% are under the age of 30, indicating the Company’s effort to bring new blood into the organization.
A relatively low turnover rate, 5%, is observed at the FENC sites in Japan. The Company creates a win-win by providing comprehensive welfare systems to employees, fostering work-life balance and generating cohesiveness to help them refine work performance and efficiency. The 2024 turnover rate at FENC sites in the U.S. is 12%, a slight uptick comparing with past years. FENC is reviewing and adjusting the employee welfare systems to retain employees by providing a workplace featuring attractive working conditions and development opportunities.
Number and Rate of New Employee Hires
| 2024 | Under 30 | 31-50 | Over 51 | Total | |||||||
Male | Female | Subtotal | Male | Female | Subtotal | Male | Female | Subtotal | |||
Taiwan | Number | 87 | 30 | 117 | 38 | 14 | 52 | 2 | 1 | 3 | 172 |
% | 19% | 23% | 20% | 2% | 2% | 2% | 0.3% | 0.3% | 0% | 4% | |
Mainland China | Number | 176 | 85 | 261 | 166 | 171 | 337 | 8 | 1 | 9 | 607 |
% | 54% | 54% | 54% | 10% | 10% | 10% | 2% | 3% | 2% | 14% | |
Vietnam | Number | 1,213 | 2,058 | 3,271 | 676 | 1,643 | 2,319 | 18 | 10 | 28 | 5,618 |
% | 59% | 57% | 58% | 40% | 45% | 43% | 23% | 14% | 19% | 50% | |
Japan | Number | 11 | 6 | 17 | 32 | 6 | 38 | 2 | 1 | 3 | 58 |
% | 22% | 40% | 26% | 17% | 15% | 17% | 22% | 25% | 23% | 19% | |
U.S | Number | 5 | 0 | 5 | 5 | 3 | 8 | 0 | 0 | 0 | 13 |
% | 20% | 0% | 17% | 9% | 23% | 11% | 0% | 0% | 0% | 8% | |
Total | Number | 1,492 | 2,179 | 3,671 | 917 | 1,837 | 2,754 | 30 | 13 | 43 | 6,468 |
% | 36% | 27% | 15% | 18% | 17% | 9% | 81% | 237% | 60% | 5% | |
| 2023年 | Under 30 | 31-50 | Over 51 | Total | |||||||
Male | Female | Subtotal | Male | Female | Subtotal | Male | Female | Subtotal | |||
Taiwan | Number | 112 | 74 | 186 | 111 | 27 | 138 | 6 | 2 | 8 | 332 |
% | 18% | 40% | 23% | 5% | 4% | 5% | 1% | 1% | 1% | 7% | |
Mainland China | Number | 345 | 126 | 471 | 322 | 237 | 559 | 10 | 5 | 15 | 1,045 |
% | 83% | 60% | 75% | 18% | 14% | 16% | 3% | 9% | 4% | 23% | |
Vietnam | Number | 390 | 484 | 874 | 332 | 374 | 706 | 8 | 3 | 11 | 1,591 |
% | 22% | 15% | 17% | 23% | 12% | 15% | 11% | 5% | 8% | 16% | |
Japan | Number | 29 | 4 | 33 | 54 | 23 | 77 | 1 | 0 | 1 | 111 |
% | 57% | 27% | 50% | 27% | 64% | 33% | 20% | 0% | 9% | 36% | |
U.S | Number | 1 | 1 | 2 | 3 | 1 | 4 | 1 | 0 | 1 | 7 |
% | 4% | 20% | 7% | 5% | 9% | 6% | 2% | 0% | 1% | 4% | |
Total | Number | 877 | 689 | 1,566 | 822 | 662 | 1,484 | 26 | 10 | 36 | 3,086 |
% | 19% | 15% | 8% | 10% | 10% | 5% | 40% | 114% | 30% | 14% | |
| 2022 | Under 30 | 31-50 | Over 51 | Total | |||||||
Male | Female | Subtotal | Male | Female | Subtotal | Male | Female | Subtotal | |||
Taiwan | Number | 174 | 106 | 280 | 175 | 39 | 214 | 4 | 1 | 5 | 499 |
% | 25% | 52% | 31% | 8% | 6% | 7% | 0% | 0% | 0% | 10% | |
Mainland China | Number | 390 | 125 | 515 | 351 | 221 | 572 | 5 | 1 | 6 | 1,093 |
% | 85% | 49% | 72% | 19% | 13% | 16% | 2% | 11% | 2% | 24% | |
Vietnam | Number | 1,803 | 3,334 | 5,137 | 617 | 1,626 | 2,243 | 11 | 9 | 20 | 7,400 |
% | 75% | 76% | 76% | 41% | 51% | 47% | 17% | 19% | 18% | 64% | |
Japan | Number | 7 | 2 | 9 | 15 | 6 | 21 | 1 | 0 | 1 | 31 |
% | 21% | 15% | 20% | 10% | 22% | 12% | 8% | 0% | 5% | 13% | |
U.S | Number | 6 | 2 | 8 | 9 | 1 | 10 | 1 | 0 | 1 | 19 |
% | 21% | 50% | 24% | 15% | 10% | 14% | 2% | 0% | 1% | 10% | |
Total | Number | 2,602 | 3,646 | 6,248 | 1,337 | 2,024 | 3,361 | 22 | 12 | 34 | 9,643 |
% | 60% | 45% | 26% | 38% | 38% | 19% | 160% | 486% | 120% | 44% | |
| 2021 | Under 30 | 31-50 | Over 51 | Total | |||||||
Male | Female | Subtotal | Male | Female | Subtotal | Male | Female | Subtotal | |||
Taiwan | Number | 47 | 14 | 61 | 69 | 16 | 85 | 2 | 3 | 5 | 151 |
% | 12% | 9% | 11% | 4% | 3% | 4% | 1% | 1% | 1% | 4% | |
Mainland China | Number | 899 | 347 | 1,246 | 715 | 465 | 1,180 | 10 | 0 | 10 | 2,436 |
% | 160% | 92% | 133% | 38% | 26% | 32% | 4% | 0% | 4% | 50% | |
Vietnam | Number | 1,167 | 2,491 | 3,658 | 337 | 1,094 | 1,431 | 6 | 12 | 18 | 5,107 |
% | 56% | 64% | 61% | 27% | 38% | 34% | 9% | 33% | 18% | 50% | |
Japan | Number | 7 | 3 | 10 | 13 | 2 | 15 | 0 | 0 | 0 | 25 |
% | 19% | 38% | 23% | 15% | 14% | 15% | 0% | 0% | 0% | 16% | |
U.S | Number | 14 | 1 | 15 | 10 | 2 | 12 | 1 | 1 | 2 | 29 |
% | 48% | 50% | 48% | 17% | 22% | 18% | 2% | 5% | 2% | 16% | |
Total | Number | 2,134 | 2,856 | 4,990 | 1,144 | 1,579 | 2,723 | 19 | 16 | 35 | 7,748 |
% | 69% | 64% | 66% | 23% | 29% | 26% | 1% | 4% | 2% | 40% | |
| Note: 1. “Number of new employee hires” refers to the total number of employees hired by the FENC sites in a specific region. Beginning in 2024, disclosures on non-permanent employees have been included in the report, including retrospective data collection that dates back to 2022. 2. The rate is derived by dividing the number of the new employees hires of an age group by the total number of employees of the same age group, gender and region. |
Number and Rate of Resignations
2024 | Under 30 | 31-50 | Over 51 | Total | |||||||
Male | Female | Subtotal | Male | Female | Subtotal | Male | Female | Subtotal | |||
Taiwan | Number | 75 | 41 | 116 | 182 | 58 | 240 | 166 | 52 | 218 | 574 |
% | 16% | 32% | 20% | 8% | 9% | 9% | 21% | 16% | 20% | 13% | |
Mainland China | Number | 199 | 81 | 280 | 285 | 254 | 539 | 53 | 46 | 99 | 918 |
% | 61% | 52% | 58% | 16% | 15% | 16% | 15% | 153% | 27% | 22% | |
Vietnam | Number | 1,044 | 1,778 | 2,822 | 665 | 1,672 | 2,337 | 17 | 17 | 34 | 5,193 |
% | 51% | 49% | 50% | 39% | 42% | 44% | 22% | 24% | 23% | 47% | |
Japan | Number | 2 | 1 | 3 | 11 | 0 | 11 | 1 | 0 | 1 | 15 |
% | 4% | 7% | 5% | 6% | 0% | 5% | 11% | 0% | 8% | 5% | |
U.S | Number | 1 | 0 | 1 | 7 | 1 | 8 | 7 | 5 | 12 | 21 |
% | 4% | 0% | 3% | 12% | 8% | 11% | 12% | 33% | 16% | 12% | |
Total | Number | 1,321 | 1,901 | 3,222 | 1,150 | 1,985 | 3,135 | 244 | 120 | 364 | 6,721 |
% | 45% | 49% | 47% | 20% | 33% | 26% | 19% | 27% | 21% | 33% | |
2023 | Under 30 | 31-50 | Over 51 | Total | |||||||
Male | Female | Subtotal | Male | Female | Subtotal | Male | Female | Subtotal | |||
Taiwan | Number | 116 | 33 | 149 | 232 | 37 | 269 | 119 | 25 | 144 | 562 |
% | 18% | 18% | 18% | 11% | 6% | 6% | 13% | 7% | 12% | 12% | |
Mainland China | Number | 340 | 130 | 470 | 429 | 366 | 795 | 29 | 9 | 38 | 1,303 |
% | 82% | 62% | 75% | 23% | 21% | 22% | 8% | 17% | 10% | 29% | |
Vietnam | Number | 833 | 1,255 | 2,088 | 506 | 917 | 1,423 | 25 | 14 | 39 | 3,550 |
% | 48% | 38% | 41% | 35% | 29% | 31% | 35% | 23% | 30% | 36% | |
Japan | Number | 4 | 1 | 5 | 18 | 3 | 21 | 1 | 0 | 1 | 27 |
% | 8% | 7% | 8% | 9% | 8% | 9% | 20% | 0% | 9% | 9% | |
U.S | Number | 3 | 0 | 3 | 6 | 0 | 6 | 4 | 2 | 6 | 15 |
% | 12% | 0% | 10% | 10% | 0% | 9% | 6% | 11% | 7% | 8% | |
Total | Number | 1,296 | 1,419 | 2,715 | 1,191 | 1,323 | 2,514 | 178 | 50 | 228 | 5,457 |
% | 45% | 38% | 41% | 21% | 24% | 22% | 13% | 10% | 12% | 28% | |
2022 | Under 30 | 31-50 | Over 51 | Total | |||||||
Male | Female | Subtotal | Male | Female | Subtotal | Male | Female | Subtotal | |||
Taiwan | Number | 112 | 37 | 149 | 260 | 50 | 310 | 89 | 19 | 108 | 567 |
% | 16% | 18% | 16% | 12% | 7% | 11% | 9% | 6% | 8% | 11% | |
Mainland China | Number | 470 | 160 | 630 | 488 | 451 | 939 | 25 | 13 | 38 | 1,607 |
% | 91% | 58% | 80% | 25% | 25% | 25% | 9% | 34% | 11% | 33% | |
Vietnam | Number | 1,657 | 2,647 | 4,304 | 620 | 1,530 | 2,150 | 19 | 14 | 33 | 6,487 |
% | 69% | 60% | 63% | 41% | 48% | 45% | 29% | 30% | 29% | 56% | |
Japan | Number | 2 | 0 | 2 | 2 | 1 | 3 | 1 | 6 | 7 | 12 |
% | 6% | 0% | 4% | 1% | 4% | 2% | 8% | 86% | 35% | 5% | |
U.S | Number | 3 | 0 | 3 | 4 | 0 | 4 | 5 | 1 | 6 | 13 |
% | 10% | 0% | 9% | 6% | 0% | 6% | 8% | 5% | 7% | 5% | |
Total | Number | 2,244 | 2,844 | 5,088 | 1,374 | 2,032 | 3,406 | 139 | 53 | 192 | 8,686 |
% | 61% | 58% | 59% | 24% | 35% | 29% | 10% | 12% | 10% | 40% | |
2021 | Under 30 | 31-50 | Over 51 | Total | |||||||
Male | Female | Subtotal | Male | Female | Subtotal | Male | Female | Subtotal | |||
Taiwan | Number | 65 | 18 | 83 | 110 | 22 | 132 | 97 | 17 | 114 | 329 |
% | 17% | 11% | 15% | 6% | 4% | 6% | 10% | 5% | 9% | 8% | |
Mainland China | Number | 919 | 347 | 1,266 | 726 | 520 | 1,246 | 21 | 10 | 31 | 2,543 |
% | 164% | 92% | 135% | 39% | 29% | 34% | 9% | 143% | 12% | 52% | |
Vietnam | Number | 1,832 | 2,956 | 4,788 | 593 | 1,439 | 2,032 | 17 | 20 | 37 | 6,857 |
% | 88% | 76% | 80% | 47% | 50% | 49% | 26% | 56% | 36% | 63% | |
Japan | Number | 2 | 1 | 3 | 5 | 1 | 6 | 0 | 0 | 0 | 9 |
% | 6% | 13% | 7% | 6% | 7% | 6% | 0% | 0% | 0% | 6% | |
U.S | Number | 0 | 0 | 0 | 5 | 2 | 7 | 7 | 1 | 8 | 15 |
% | 0% | 0% | 0% | 9% | 22% | 10% | 11% | 5% | 10% | 8% | |
Total | Number | 1,883 | 2,546 | 4,429 | 1,237 | 1,651 | 2,888 | 128 | 46 | 174 | 7,491 |
% | 61% | 57% | 59% | 25% | 31% | 28% | 9% | 11% | 10% | 35% | |
| Note: 1. “Resignations” refers to the total number of employees who resigned from FENC sites in a specific region. Beginning in 2024, disclosures on non-permanent employees have been included in the report, including retrospective data collection that dates back to 2022. 2. The rate is derived by dividing the number of the resignations of an age group by the total number of employees of the same age group, gender and region. |
Number and Rate of Voluntary and Involuntary Resignations
Taiwan | ||||||||
2021 | 2022 | 2023 | 2024 | |||||
Number of | % | Number of | % | Number of | % | Number of | % | |
Voluntary | 259 | 6% | 560 | 11% | 523 | 11% | 450 | 10% |
Involuntary | 70 | 2% | 7 | 0% | 39 | 1% | 124 | 3% |
Total | 329 | 8% | 567 | 11% | 562 | 12% | 574 | 13% |
Mainland China | ||||||||
2021 | 2022 | 2023 | 2024 | |||||
Number of | % | Number of | % | Number of | % | Number of | % | |
Voluntary | 2,399 | 49% | 1,403 | 29% | 1,116 | 24% | 794 | 19% |
Involuntary | 144 | 3% | 204 | 4% | 187 | 4% | 124 | 3% |
Total | 2,543 | 52% | 1,607 | 33% | 1,303 | 29% | 918 | 22% |
Vietnam | ||||||||
2021 | 2022 | 2023 | 2024 | |||||
Number of | % | Number of | % | Number of | % | Number of | % | |
Voluntary | 5,952 | 55% | 3,816 | 33% | 2,828 | 29% | 2,869 | 26% |
Involuntary | 905 | 8% | 2,671 | 23% | 722 | 7% | 2,324 | 21% |
Total | 6,857 | 63% | 6,487 | 56% | 3,550 | 36% | 5,193 | 47% |
Japan | ||||||||
2021 | 2022 | 2023 | 2024 | |||||
Number of | % | Number of | % | Number of | % | Number of | % | |
Voluntary | 9 | 6% | 12 | 5% | 27 | 9% | 15 | 5% |
Involuntary | 0 | 0% | 0 | 0% | 0 | 0% | 0 | 0% |
Total | 9 | 6% | 12 | 5% | 27 | 9% | 15 | 5% |
U.S | ||||||||
2021 | 2022 | 2023 | 2024 | |||||
Number of | % | Number of | % | Number of | % | Number of | % | |
Voluntary | 12 | 7% | 11 | 6% | 15 | 8% | 19 | 11% |
Involuntary | 3 | 2% | 2 | 1% | 0 | 0% | 2 | 1% |
Total | 15 | 8% | 13 | 7% | 15 | 8% | 21 | 12% |
Total | ||||||||
2021 | 2022 | 2023 | 2024 | |||||
Number of | % | Number of | % | Number of | % | Number of | % | |
Voluntary | 6,930 | 35% | 5,802 | 26% | 4,509 | 23% | 4,147 | 20% |
Involuntary | 561 | 3% | 2,884 | 13% | 948 | 5% | 2,574 | 13% |
Total | 7,491 | 35% | 8,686 | 40% | 5,457 | 28% | 6,721 | 33% |
| Note: 1. The term, voluntary resignation, refers to the termination of employment relationships initiated by employees, such as the request to resign or retire. 2. The term, involuntary resignation, refers to the termination of employment relationships initiated by the employer or in accordance with the law, such as retirement upon the statutory retirement age, retirement with distinctions, dismissal and contract termination. 3. The percentage is calculated by dividing the numbers of voluntary resignation and involuntary resignation by the number of employees in the region. 4. “Resignations” refers to the total number of employees who resigned from FENC sites in a specific region. Beginning in 2022, disclosures on non-permanent employees have been included in the report, including retrospective data collection that dates back to 2022. |