Water Resources Management
We regard water as a shared resource. We value local water resources and their surrounding environment at all production sites.
FENC believes that water resources should be shared and protected, and pays close attention to the health of water resources and environment in regions that house its production sites. The Company continues to lower water consumption during production by establishing reduction targets for water withdrawal per unit of production. Partnering with its customers, FENC strives to protect water resources. Its water resources management plan has 100% coverage, and takes governmental policies, corporate development, industry evolvement as well as the local needs into consideration. FENC manages, allocates and distributes water resources in a reasonable and effective manner, aiming to minimize consumption and maximize efficiency during storage and utilization. In addition, the quantity and approach of water withdrawal at FENC do not pose any significant negative impact on the water sources as well as the surrounding habitats and residents.
Water Resources System Establishment and Management
.png)
Water Conservation Measures and Performance
1. Avoidance
- Water conservation devices and technologies are incorporated to reduce water withdrawal. The pipelines and equipment are inspected and maintained regularly to avoid leakage and waste. Water conservation training is provided to heighten staff awareness and encourage employees to integrate water conservation practices into their work routines.
2. Rainwater Recycling
Rainwater is harvested in the retention pond to replenish the cooling tower or stored for reuse. After being filtered through the RO system, the harvested rainwater may be used as domestic water.
- At FENV, a total of 5,733 KL of rainwater was harvested and recycled in 2024 for restroom cleaning or landscape irrigation purposes.
3. Reclaimed Water Reuse
Water reclamation and reuse measures include the recycling and reuse of water that circulates through the boiler and production process.
- WHFE used to outsource the treatment of approximately 40 KL of production wastewater to qualified suppliers. After adopting the low-temperature evaporation technology, a mechanical treatment, more than 86% of the wastewater is now treated in-house and reused for restroom cleaning. Approximately 34 KL of water is recycled annually.
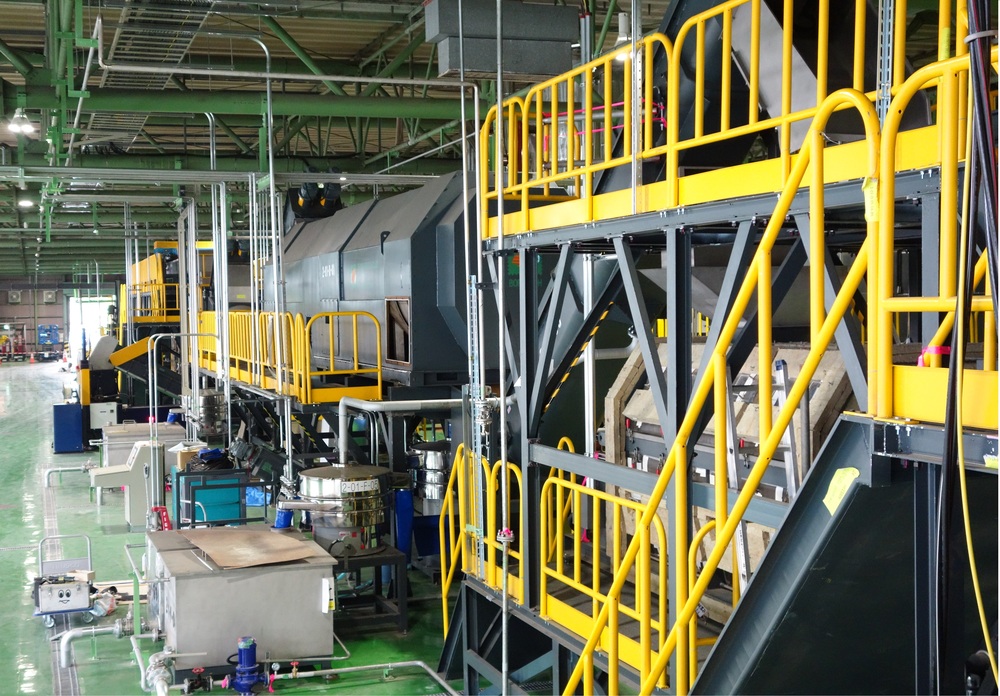
- The effluent recycling process at OGM was optimized in 2024 with additional filtration equipment, which purifies the production wastewater and loop the water back to operations such as PET bottle washing and crushing, water bath float/sink, and ditch flushing. OGM is able to recycle and reuse approximately 12,636 KL of effluent annually, which cuts down its water withdrawal. The additional filtration equipment also alleviates the burden on its wastewater treatment facilities by removing impurities from the wastewater.
4. Equipment Improvement
The filtration membranes are replaced to increase the recycling rate of reclaimed water and new equipment is incorporated to improve water efficiency.
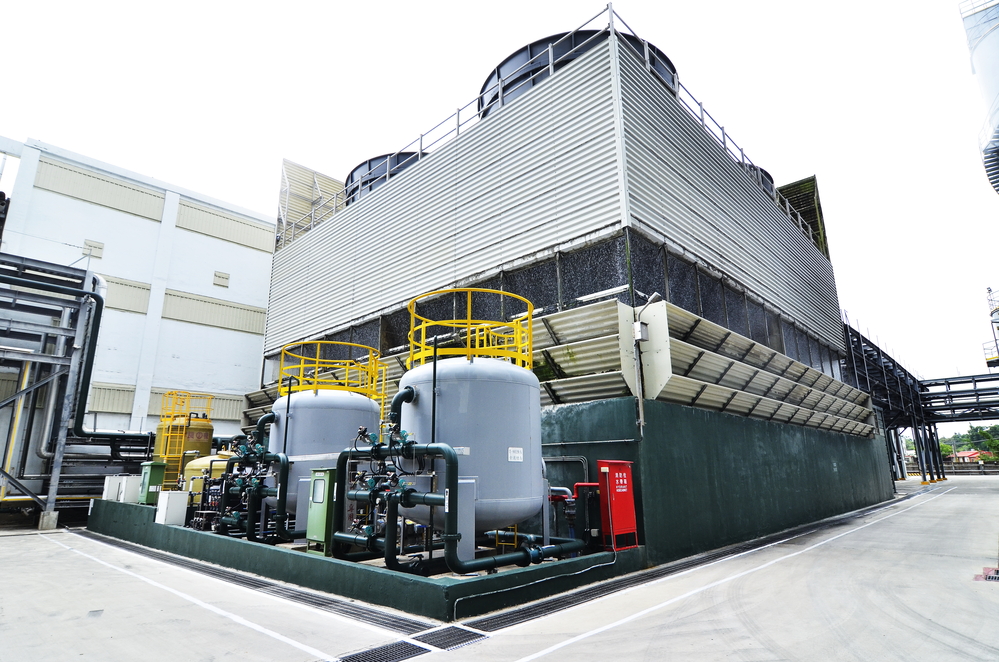
- FEFC has installed a side stream filtration system for the cooling tower, which effectively removes suspended solids in the cooling water. Its effectiveness and stability are ensured by backwashing or replacing the filter media periodically. The measure has dramatically reduced the use of cooling water by 7,200 KL in 2024.
5. Production Refinement
The refinement of production processes is ongoing with production parameters calibrated based on professional expertise to improve water conservation.
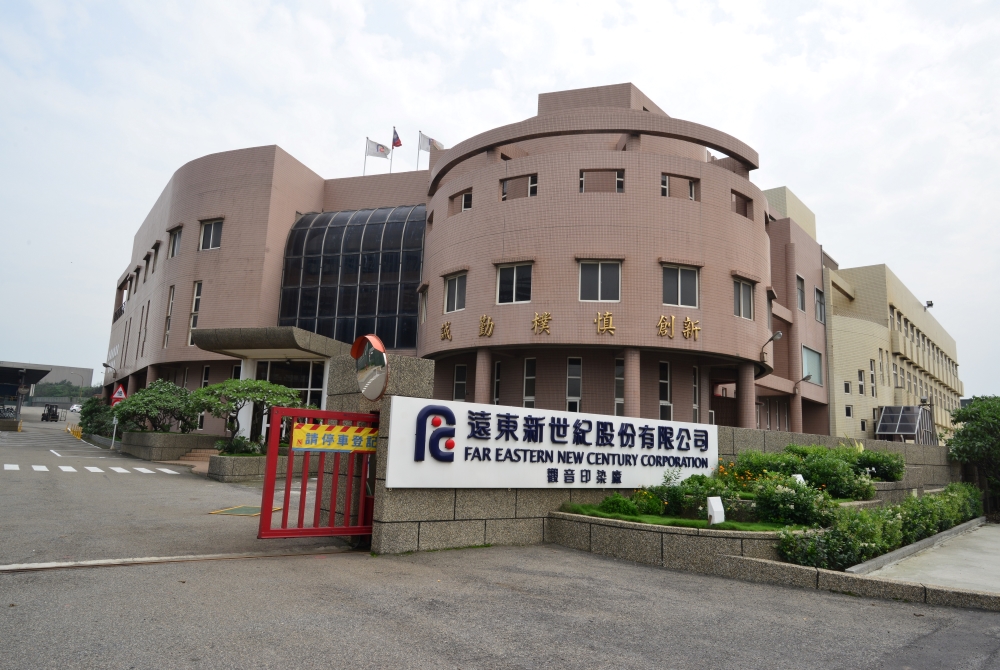
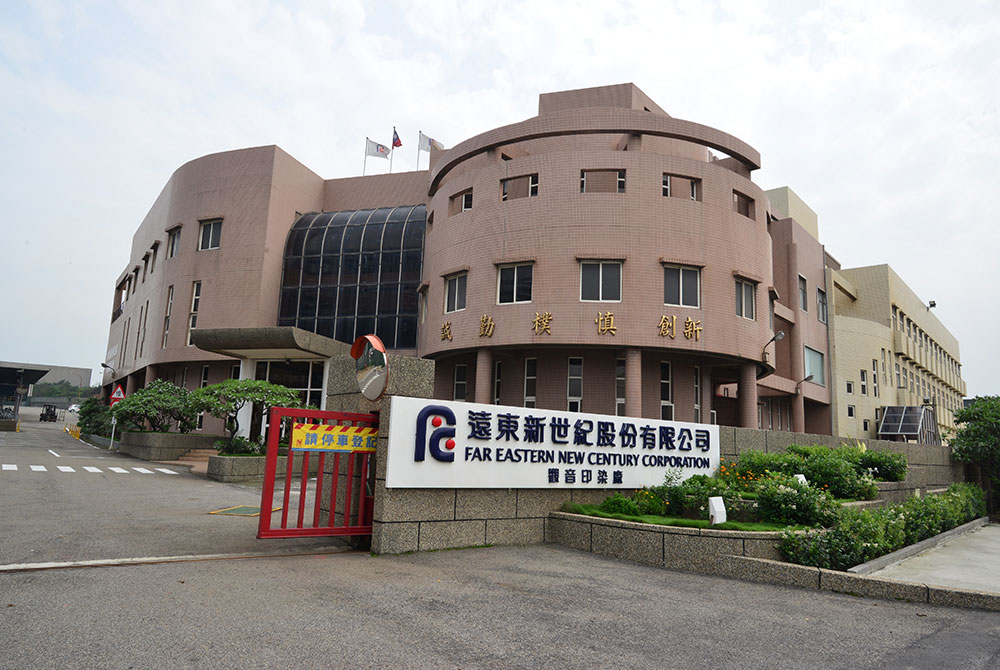
- Kuanyin Dyeing and Finishing Plant increased the cloth capacity of the printing and dyeing machine by 2.2%, which saved 7,600 KL of water in 2024.
Measures for Water Resources Management and Contingency Plan
1. Water Reserve and Contingency Plan
Response measures have been established based on the water shortage warnings issued by local governments. In Taiwan, this would refer to the water level signals issued by the Water Resources Agency. All production sites have established contingency plans to provide backup water supply during emergencies. In 2024, there were no occurrences of production interruption caused by water shortages. FENC’s emergency responses for water shortages are as follows:
- Adjust the discharge flow from water towers and air-conditioning systems to reduce the need for discharge and replenishment.
- Activate effluent recycling and the RO filtration system as a backup water source.
- When the water level in the retention pond reaches the lowest permitted level, initiate evaluation procedures to assess the need for activating the backup water supply within the production site.
- Make price inquiries regarding water tankers and delivery distance periodically, and formulate contingency plans as emergency responses.
2. Real-time Monitoring
Water meters are installed to record daily consumption, track areas with unusual water usage and perform timely repairs.
3. Incorporation of Management Systems
FENC conducts water consumption review, completes performance evaluation and optimizes the daily management of major water facilities based on the international standards of ISO 46001:2019 water efficiency management systems-requirements and usage guidelines. The Company also incorporates the Plan-Do-Check-Act cycle regarding the improvement of water recycling procedures and formulation of response strategies and actions that address water risks and opportunities, as well as the establishment, implementation, operation and control of the water efficiency targets.
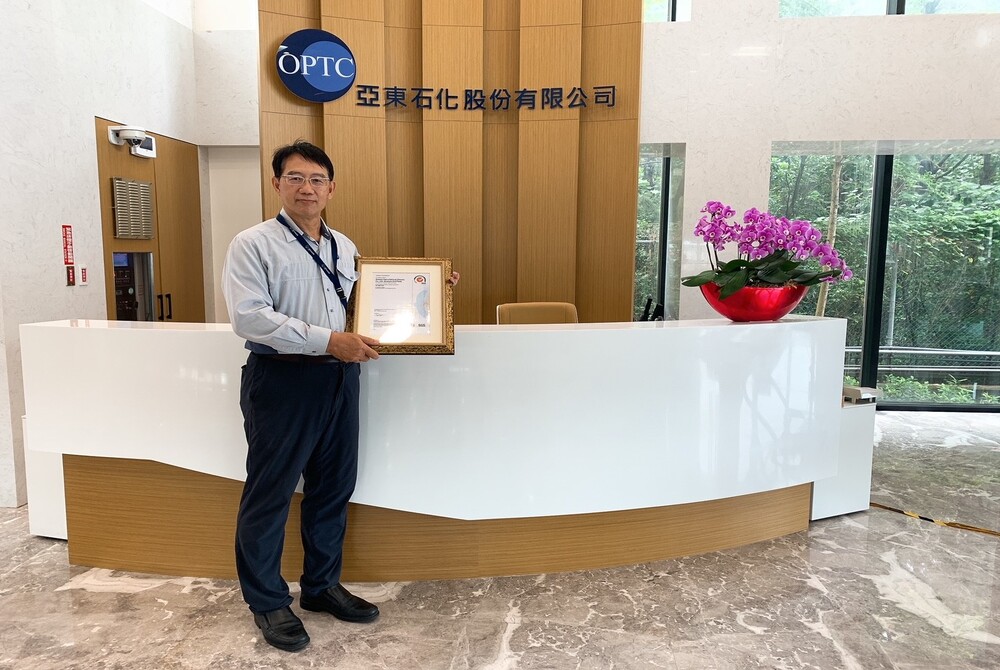
- In March 2022, OPTC-Plant 2 was among the first ten entities in Taiwan to obtain the ISO 46001 certification. The plant also passed the reassessment in 2024.
Water Consumption Performance
Water Withdrawal in 2024
.png)
Water Withdrawal per Unit Production
Unit: kiloliter / metric ton of production
.png)
Water Withdrawal and Water Consumption
Unit: megaliter
Rivers/Lakes/Streams | Third-party Water | Groundwater | Rainwater | Total Water Withdrawal | Total Water Consumption | Water Withdrawal per Unit Production | ||
| Petrochemical | 2021 | 5,556 | 7,574 | 54 | 12 | 13,196 | 6,985 | 5.56 |
2022 | 5,449 | 6,900 | 0 | 13 | 12,362 | 6,111 | 5.93 | |
2023 | 5,141 | 5,599 | 0 | 10 | 10,750 | 5,378 | 5.83 | |
2024 | 4,112 | 2,302 | 0 | 0 | 6,414 | 2,898 | 4.66 | |
| Polyester | 2021 | 1,666 | 2,356 | 1,794 | 144 | 5,960 | 2,919 | 1.14 |
2022 | 1,424 | 2,094 | 1,723 | 122 | 5,363 | 2,658 | 1.11 | |
2023 | 1,146 | 2,051 | 1,489 | 92 | 4,778 | 2,384 | 0.99 | |
2024 | 1,583 | 2,151 | 1,496 | 109 | 5,339 | 2,714 | 1.08 | |
| Textile | 2021 | 1,572 | 2,418 | 89 | 49 | 4,128 | 801 | 8.08 |
2022 | 1,340 | 1,692 | 81 | 19 | 3,132 | 606 | 6.82 | |
2023 | 1,005 | 1,492 | 64 | 60 | 2,621 | 641 | 6.39 | |
2024 | 801 | 1,415 | 60 | 125 | 2,401 | 549 | 6.37 | |
| Total | 2021 | 8,794 | 12,348 | 1,937 | 205 | 23,284 | 10,705 | 2.85 |
2022 | 8,213 | 10,686 | 1,804 | 154 | 20,857 | 9,375 | 2.81 | |
2023 | 7,292 | 9,142 | 1,553 | 162 | 18,149 | 8,403 | 2.55 | |
2024 | 6,496 | 5,868 | 1,556 | 234 | 14,154 | 6,161 | 2.09 | |
| Note: 1. Rivers, lakes, streams and rainwater are surface water. Third-party water refers to tap water as well as wastewater from external organizations. Groundwater includes well water. 2. The difference between water withdrawal and effluent discharge is considered water consumption, which is mainly the result of evaporation at the cooling tower. Loss during production is a minor contributor. 3. The concentration of total dissolved solids (TDS) across the water withdrawal categories are under 1,000 mg/L. 4. No quarry water, seawater, or produced water that enters an organization’s boundary because of extraction (e.g., crude oil) , processing (e.g., sugar cane crushing) , or use of any raw material, and has to consequently be managed by the organization is used at any of FENC production sites. 5. Data collection on water resources management accounts for 100% of the major production sites within the production business. 6. The boundary of data collection for water withdrawal per unit of production for the Textile Business does not include FEAZ, FENV and FEAV. |


