Environmental Management
Consistently in efforts to enhance waste management at all production sites. We implement waste avoidance and promote recycling and classification so that resources can be reused.
General Waste and Hazardous Industrial Waste Management Policies
.png)
- Waste Management Goal and Principle
FENC strives to optimize waste management by improving resource efficiency in production activities, reducing waste through avoidance, and boosting the recycling and remanufacturing rates of production waste. The principle governing waste management is “classification to reduction; waste to earnings; earnings to valuables.” - Waste Disposal and Recycling
Qualified waste treatment companies are selected to ensure the recycling and reuse of valuable waste, and the proper disposal of valueless waste. - Compliance and Social Responsibility
Waste treatment is conducted in accordance with all applicable regulations and the quantity is filed with the authority as required by law. FENC will strengthen the control of hazardous waste, and track the type, quantity, destination, storage, utilization and treatment of outsourced hazardous waste to ensure compliance.
Waste Impact Assessment
Waste materials generated from the business activities at FENC can be broken down into 89% regular industrial waste and 11% hazardous industrial waste. The hazardous industrial waste includes used chemical bottles for testing, lubricant/oil and light tube/electrical batteries, which are stored in hazardous waste storage facilities and processed 100% by qualified waste management companies. There were no occurrences of waste leakage at FENC in 2024, and the waste treatment did not pose any substantial and significant impact on the environment.
Management Procedure for Waste Disposal Suppliers
.png)
Waste Treatment Process Flow
.png)
Waste Generated in 2024
.png)
Waste Volume per Unit of Production
Unit: kg / metric ton of production
.png)
Waste Generated per Unit of Production
Unit: kg / metric ton of production
| 2021 | 2022 | 2023 | 2024 | |
Treatment Methods | Recycling and Reuse | 13.92 | 12.68 | 12.89 | 13.13 |
Non-Recycling and Non-Reuse | 2.25 | 2.47 | 2.30 | 2.05 | |
Type | General Industrial Waste | 15.36 | 14.73 | 14.27 | 14.82 |
Hazardous Industrial Waste | 0.81 | 0.42 | 0.92 | 0.36 | |
Total | 16.17 | 15.16 | 15.19 | 15.18 | |
Note: The data does not include FEAZ, FEAV and FENV.
Waste Generated
Unit: metric tons
Treatment Methods | Type | Total Waste | ||||
Recycling and Reuse | Non-Recycling and Non-Reuse | General Industrial Waste | Hazardous Industrial Waste | |||
Petrochemical | 2021 | 5,525 | 2,060 | 4,533 | 3,052 | 7,585 |
2022 | 3,196 | 1,395 | 3,701 | 890 | 4,591 | |
2023 | 4,511 | 1,919 | 3,667 | 2,763 | 6,430 | |
2024 | 2,361 | 218 | 2,579 | 0 | 2,579 | |
Polyester | 2021 | 90,557 | 11,390 | 100,692 | 1,255 | 101,947 |
2022 | 77,187 | 11,558 | 87,746 | 999 | 88,745 | |
2023 | 74,596 | 12,020 | 84,010 | 2,606 | 86,616 | |
2024 | 72,682 | 11,367 | 82,791 | 1,258 | 84,049 | |
Textile | 2021 | 18,463 | 5,030 | 21,186 | 2,307 | 23,493 |
2022 | 15,334 | 5,544 | 19,577 | 1,301 | 20,878 | |
2023 | 13,599 | 2,445 | 14,867 | 1,177 | 16,044 | |
2024 | 14,370 | 2,236 | 15,406 | 1,200 | 16,606 | |
| Total | 2021 | 114,545 | 18,480 | 126,411 | 6,614 | 133,025 |
2022 | 95,717 | 18,497 | 111,024 | 3,190 | 114,214 | |
2023 | 92,706 | 16,384 | 102,544 | 6,546 | 109,090 | |
2024 | 89,413 | 13,821 | 100,776 | 2,458 | 103,234 | |
Compared with 2023, the total waste generated in 2024 dropped by 5%, and the total waste per unit of production remained at the 2023 level mainly due to production decrease and adjustments in the industry structure. FENC remains committed to waste avoidance and resource circulation by conducting waste audits to identify opportunities for improving waste performance, and by establishing improvement and action plans to implement reduction, recycling, and reuse.
Data of Waste
Unit: metric tons
Type and Treatment Method | 2021 | 2022 | 2023 | 2024 | |||
Recyclable and Reusable Wastes | General Business Wastes | Manufacturing Process Wastes | On-site recycling and reuse | 25,840 | 18,497 | 32,344 | 24,333 |
Sold | 30,475 | 28,230 | 22,775 | 25,160 | |||
Off-site processing | 53,267 | 45,993 | 32,739 | 38,504 | |||
Domestic Wastes | On-site recycling and reuse | 0 | 0 | 0 | 0 | ||
Sold | 280 | 514 | 245 | 303 | |||
Off-site processing | 841 | 720 | 82 | 99 | |||
Hazardous Business Wastes | On-site recycling and reuse | 0 | 0 | 0 | 0 | ||
Sold | 311 | 362 | 422 | 399 | |||
Off-site processing | 3,531 | 1,401 | 4,099 | 615 | |||
Total Recyclable and Reusable Wastes | 114,545 | 95,717 | 92,706 | 89,413 | |||
Non-recyclable and Non-reusable Wastes | General Business Wastes | Manufacturing Process Wastes | Incineration With Energy Recovery (On-Site) | 0 | 495 | 2,344 | 2,816 |
Incineration With Energy Recovery (Off-Site) | 344 | 891 | 598 | 968 | |||
Incineration Without Energy Recovery | 6,736 | 3,555 | 2,802 | 2,428 | |||
Landfilling | 22 | 62 | 35 | 137 | |||
Other Treatment Methods | 2,905 | 6,128 | 2,894 | 1,718 | |||
Domestic Wastes | Incineration With Energy Recovery (On-Site) | 0 | 0 | 0 | 0 | ||
Incineration With Energy Recovery (Off-Site) | 423 | 333 | 407 | 75 | |||
Incineration Without Energy Recovery | 1,463 | 1,248 | 1,808 | 1,438 | |||
Landfilling | 2,324 | 2,426 | 1,795 | 1,895 | |||
Other Treatment Methods | 1,491 | 1,932 | 1,676 | 902 | |||
Hazardous Business Wastes | Incineration With Energy Recovery (On-Site) | 0 | 0 | 0 | 0 | ||
Incineration With Energy Recovery (Off-Site) | 55 | 25 | 59 | 3 | |||
Incineration Without Energy Recovery | 2,691 | 1,373 | 1,677 | 1,280 | |||
Landfilling | 1 | 1 | 5 | 1 | |||
Other Treatment Methods | 25 | 28 | 284 | 160 | |||
Total Non-recyclable and Non-reusable Wastes | 18,480 | 18,497 | 16,384 | 13,821 | |||
Total Wastes | 133,025 | 114,214 | 109,090 | 103,234 | |||
| Note: 1. Waste materials are classified based on local governmental regulations. For instance, sludge generated from wastewater treatment is deemed hazardous industrial waste based on the definitions of Chinese and Vietnamese governments while it is deemed as general industiral waste in Taiwan. 2. Non-recycling and non-reused waste disposal are handled off-site by qualified waste treatment companies. 3. Data collection on Waste accounts for covering 100% of the main production sites of the production business. 4. The waste disclosures from 2021, 2022, 2023 and 2024 have been 100% verified by SGS. |
Supply Chain Management and Education Training
FENC conducts safety training for waste treatment suppliers. The training raises their environmental awareness by covering safety precautions when loading waste materials and the plant security management system. A total of 209 participants, representing 66% of the 72 general waste treatment suppliers, attended the training in 2024; a total of 164 participants, accounting for 76% of the 22 hazardous waste treatment suppliers, were also in attendance.
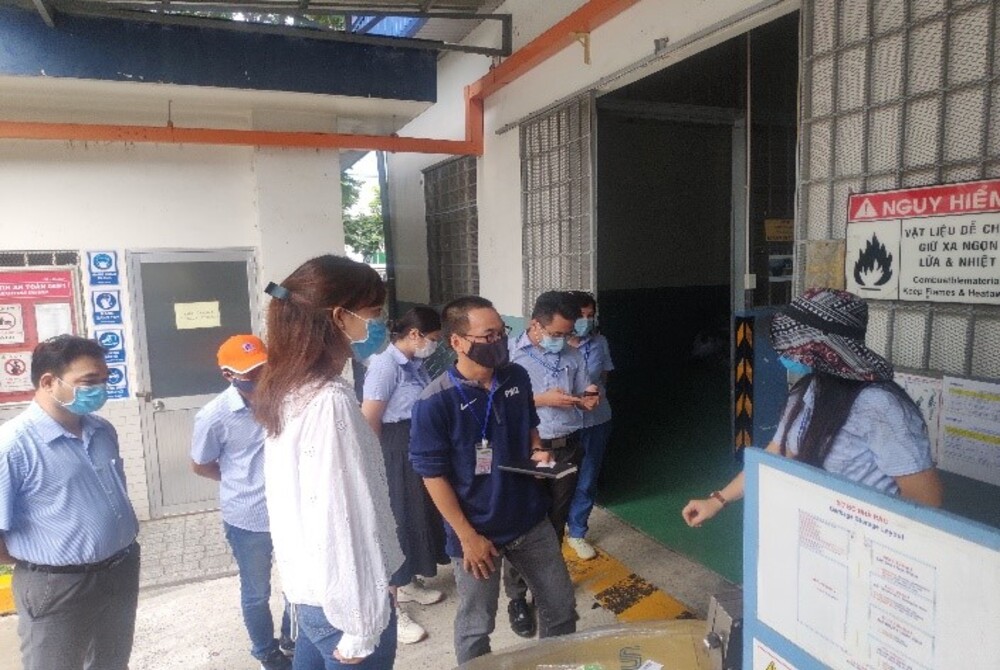
FEAV participated in the waste management exchange program that Nike, its brand customer, organized for the suppliers to tackle waste through avoidance, recycling and reuse. FEAV launched its waste management program in 2023 with the aim to minimize waste. The plant listed specific management strategies targeting nearly 50 types of waste materials, such as waste fabrics, containers and oil. The plant also reinforced waste management training by conducting quarterly workshops and forming working groups and learning groups for employees to share practices in waste reduction and recycling. These approaches are helping FEAV accomplish its environmental goals.


